

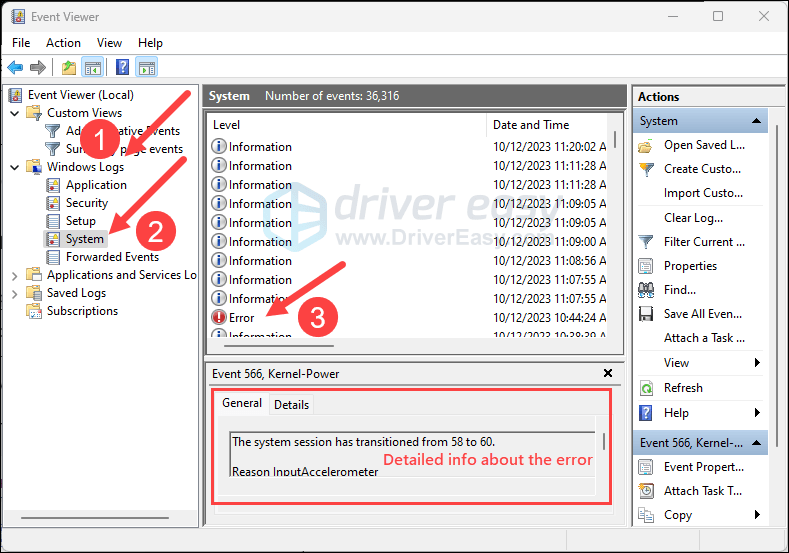
Open Event Viewer by pressing Win + X and selecting “Event Viewer.” Navigate to Windows Logs > System and filter for Critical and Error events. The timestamps correspond to your crash times, and each log entry contains the exact error code, source, and description that caused the crash.
That quick answer gets you started, but finding crash logs in Windows 11 goes far deeper than Event Viewer. In years of diagnosing Windows machines, I have seen people chase the wrong fix for weeks simply because they never read the actual log. Windows 11 stores crash data in multiple locations, and knowing where to look means you can pinpoint the root cause instead of guessing.
Where Are Crash Logs Stored in Windows 11
Windows 11 stores crash logs in Event Viewer, Reliability Monitor, and as dump files in the system directory. Event Viewer holds the most detailed logs.
Reliability Monitor gives a visual timeline. Dump files contain raw memory data from the moment of the crash.
Here are the exact locations:
- Event Viewer logs: Built into Windows, accessible via Win + X menu
- Dump files: C:\Windows\Minidump (small dumps) or C:\Windows\MEMORY.DMP (full dumps)
- Reliability Monitor data: Accessible through Control Panel or search
- Windows Error Reporting logs: C:\ProgramData\Microsoft\Windows\WER
Most people only check one of these. In reality, cross-referencing two or three sources gives you the real picture.
A dump file without an Event Viewer entry often points to a hardware problem. An Event Viewer error without a dump usually means a driver crashed gracefully rather than blue-screening.
How to Use Event Viewer to Find Crash Logs in Windows 11
Event Viewer is the single most powerful built-in tool for reading crash logs. Press Win + X, click Event Viewer, then expand Windows Logs and click System. Filter the log by Critical and Error levels to see only crash-related entries.
Step-by-step: Filtering crash events in Event Viewer
- Press Win + X and select Event Viewer
- In the left pane, expand Windows Logs
- Click System for driver and OS-level crashes or Application for app crashes
- In the right Actions pane, click Filter Current Log
- Under Event level, check only Critical and Error
- Click OK to apply
Reading the Event Viewer log entries
Each log entry shows a timestamp, Event ID, Source, and Description. The Event ID is the most important detail. Event ID 41 means the system rebooted unexpectedly.
Event ID 1001 is tied to Windows Error Reporting and blue screen events. Event ID 6008 shows a dirty shutdown.
The Description field contains the actual error code. Look for bug check codes like 0x000000EF (critical process died) or 0x0000003B (system service exception). These codes tell you whether you are dealing with a driver issue, memory fault, or storage problem.
If you see a recurring error code tied to a specific driver file like nvlddmkm.sys or ntoskrnl.exe, you have your culprit. Many users see generic errors like error 0x8000ffff catastrophic failure in Windows 11 without realizing these can appear in crash logs too and point to corrupted system components.
How to Check Blue Screen Crash Logs in Windows 11
Blue screen crash logs are recorded under Event ID 1001 with the source “BugCheck.” Open Event Viewer, go to Windows Logs > System, and filter for Event ID 1001. Each entry shows the blue screen error code and the dump file location.
What to look for in BSOD entries
- Bugcheck code: The hex code that identifies the crash type
- Bugcheck parameters: Four additional values that narrow down the cause
- Dump file path: Usually points to C:\Windows\Minidump
- Probably caused by: Sometimes Event Viewer names the exact driver
Windows 11 sometimes fails to create dump files even when blue screens occur. This happens when the page file is too small or when the crash happens so fast that the dump write cannot complete.
If your Minidump folder is empty despite repeated blue screens, increase your page file size and make sure “Write debugging information” is set to Automatic memory dump under System Properties > Advanced > Startup and Recovery.
How to Read Windows 11 Crash Dump Files
Crash dump files in C:\Windows\Minidump use the .dmp extension. You need a tool like WinDbg (Windows Debugging Tools) or the free BlueScreenView utility to read them. WinDbg gives the deepest analysis, while BlueScreenView offers a simpler visual interface.
Using BlueScreenView
- Download BlueScreenView from NirSoft’s website
- Run the tool — it auto-loads all dump files from C:\Windows\Minidump
- Click on each crash entry to see which driver caused the crash
- The driver highlighted in red/pink at the bottom pane is the likely culprit
Using WinDbg for deeper analysis
Install WinDbg from the Microsoft Store. Open a dump file, then type !analyze -v in the command window.
WinDbg will output the probable cause, the faulting module, and a full stack trace. This is overkill for most users but invaluable when the crash cause is not obvious.
Crash dumps sometimes point to ntoskrnl.exe as the cause. This is misleading. ntoskrnl.exe is the Windows kernel itself, and it appears in nearly every dump. The real cause is usually whatever called into the kernel and triggered the fault, typically a third-party driver or failing RAM.
How to Use Reliability Monitor to View Crash History
Reliability Monitor provides a timeline of system stability with all crash events plotted on a graph. Type “Reliability Monitor” or “View reliability history” in the Start menu search bar and open the tool. Click any date on the graph to see the events recorded on that day.
Reliability Monitor is especially useful when users say “my PC crashed a few times this week” but cannot remember exactly when. The graph shows red X icons for critical events and yellow warning triangles for minor issues. Click each event to see the technical details, which often match what you would find in Event Viewer but in a more digestible format.
When Reliability Monitor is more useful than Event Viewer
- When you need a quick visual overview of crash frequency over weeks or months
- When application crashes are more common than blue screens
- When you want to correlate crashes with Windows Update installations
- When the user is not technical and needs to share crash history with support
How to Find Application Crash Logs in Windows 11
Application crash logs live in Event Viewer under Windows Logs > Application. Filter for Error and Critical levels. Application crashes show up with Event IDs 1000 and 1001 and usually name the crashing executable and the faulting module DLL.
Application logs are where you see crashes for programs like Chrome, games, or Office. The log entry typically includes the application name, the faulting module path, and an exception code. If the faulting module is a .NET or Visual C++ runtime DLL, the fix is usually reinstalling the corresponding runtime package.
Some application crashes produce Windows Error Reporting (WER) files stored in C:\ProgramData\Microsoft\Windows\WER. These folders contain mini-dumps and metadata that Microsoft uses for telemetry. You can read these to get more context about why an app crashed, especially when Event Viewer alone is not clear enough.
How to Check Crash Logs Using Command Prompt or PowerShell
You can pull crash log data without opening Event Viewer by using command-line tools. PowerShell’s Get-WinEvent cmdlet queries the event log directly and lets you filter by time, event ID, and severity.
PowerShell commands for crash log retrieval
- Get-WinEvent -LogName System -MaxEvents 50 | Where-Object { $_.Level -le 2 } — Gets the last 50 critical and error events from the System log
- Get-WinEvent -FilterHashtable @{LogName=’System’; Id=1001} — Gets all blue screen (BugCheck) entries
- Get-WinEvent -LogName Application -MaxEvents 50 | Where-Object { $_.Level -eq 2 } — Gets recent application errors
For Command Prompt users, wevtutil qe System /c:20 /f:text /q:”*[System[(Level=1 or Level=2)]]” pulls the last 20 critical and error events in text format. This is useful when you need to export logs to a text file for a technician or support ticket.
Sometimes Windows Update failures leave crash-adjacent logs. If your system crashed during or after an update, check whether you are hitting known update errors like 0x800f0838 in Windows 11, which has documented causes and quick fixes.
Frequently Asked Questions
Can I check crash logs if Windows 11 does not boot?
Yes. Boot into Windows Recovery Environment by holding Shift while clicking Restart.
Navigate to Troubleshoot > Advanced Options > Command Prompt. From there, you can open Notepad and browse to C:\Windows\Minidump to read dump files, or use wevtutil to export event logs to a USB drive.
Why is my Minidump folder empty even though my PC blue screens?
Windows may not write dump files if the page file is disabled or too small, if the storage drive is failing, or if the crash happens before the dump write completes. Ensure your page file is set to System managed and that your primary drive has at least 2 GB free space.
Do third-party crash log tools work better than Event Viewer?
Tools like BlueScreenView and WhoCrashed offer a friendlier interface and do not require technical knowledge. However, they read the same dump files that Event Viewer and WinDbg access.
They do not provide deeper data — they just present it more clearly. For serious debugging, WinDbg remains the gold standard.
How far back do Windows 11 crash logs go?
Event Viewer retains logs until they hit the maximum log size, which defaults to 20 MB for the System log. Once full, older events are overwritten. You can increase the maximum log size by right-clicking the log, selecting Properties, and setting a larger size or enabling “Overwrite events as needed.”
Stop Guessing and Start Reading the Logs
The biggest mistake I see Windows 11 users make is reinstalling the operating system or replacing hardware without ever reading a single crash log. Five minutes in Event Viewer or BlueScreenView can tell you that a graphics driver is the problem, that your RAM is failing, or that a recent Windows Update broke something.
Before you reset your PC, check the logs. The answer is almost always sitting there in plain text, waiting to be read.
[…] For a step-by-step breakdown of how to interpret these logs, read how to check crash logs in Windows 11 and find exact crash causes fast. […]
[…] can also check crash logs in Windows 11 through Event Viewer to find the exact faulting module. This tells you whether the crash points to […]